Have you ever been asked to provide a report on the historical data of leads, opportunities, contacts, and accounts to see if sales users are using the system and making updates etc.?
The sales usage reports in Dynamics 365 Sales provide sales managers with a historical perspective on operational metrics and key performance indicators. By examining metrics such as leads and opportunities usage, managers can make informed decisions to enhance sales performance. Sales usage reports are available to any user that has one of the licenses below:
- Dynamics 365 Sales Premium
- Dynamics 365 Sales Enterprise
- Dynamics CE (customer engagement) for those clients that are still under an enterprise agreement or are using the Non-profit pricing
How to enable Sales Usage Reports
You must be a system admin to enable sales usage reports.
- Login to Dynamics 365 sales Hub as the system admin
- On the bottom left you will see Sales, click “Sales”, and select “App Settings”
- Under General Settings select “Sales usage reports”
- Next you will see the image below, where the feature is disabled
- Now click the slider that shows “disabled”, and you will see the word “Enabled” to the right of the slider like the image below:
At this point, reporting has been enabled, but it may take up to 24 hours for the reports to appear in Dynamics 365. Please note that the reports will contain data that has been either added or updated in Dynamics365 Sales since the day sales usage reports were enabled. Also, data is refreshed every 24 hours.
The system administrators out there, that have built a custom Model driven app, might want to know how to add Sales usage reports to their Custom Apps. This can be accomplished by the following steps:
- Open your model driven app in the maker portal
- Navigate to “Navigation”
- Then create a Group by clicking on “Add” then select “Group”
- Update the new group Title to be “Sales Analytics”
- Then create a Subarea by click on “Add” then select “Subarea”
- On the New subarea screen
- From Content type: select “Table”
- From Table: select “Sales usage telemetry reports”
- Title: remove the word telemetry from the title
- It should now read “Sales usage reports”
- Click “Save and publish”, then click play and you will see the out of the box (OOTB) Sales usage reports in your custom app.
Now that you know how to enable it, let us move on to understanding what the reports are all about.
About Sales Usage Reports
Sales usage reports are found in the Sales Hub area under “Sales Analytics” when selecting “Sales usage reports.”
The first thing you will notice is that this report is derived from a Power BI embedded report. There are four tabs within this report:
- Opportunity usage report
- Lead usage report
- Account usage report
- Contact usage report
Each report has:
- Filters
- KPI
- Charts
Let us look at which filters are available to a user:
- Date –
- This filter has three options below:
- Pick – Last, Next, This
- Number
- Days, Weeks, Weeks (Calendar), Months, Months (Calendar), Years, Years (Calendar)
- which drives the Date range you see after you select the options you want to use
- This filter has three options below:
- User –
- This filter is a list of all enabled users (system users table) in Dynamics 365 including application users and out of the box (OOTB) Microsoft native users.
- You can select 1 or more users.
- Manger –
- This Filter comes from the Manager field on the Users record.
- You can select 1 or more managers
- Business Unit
- This filter allows you to select 1 or more Business units.
- Role –
- This filter comes from the position field on the user record.
Next, let us look at what KPI’s and charts are used in each report and which common KPI’s are used. What is a KPI? KPI stands for Key Performance Indicator. It is a measurable value or metric used to evaluate the success or progress of an organization or individual in achieving specific objectives or goals. KPIs are used to track performance, identify areas for improvement, and make data-driven decisions.
Overall, the KPIs are the same for all reports. At the top of each report, you will see 4 or 5 KPIs (one more on Opportunities than on Leads, Accounts and Contacts). The four common KPI are related to the Create Read, Update, and Delete (CRUD) operations users take on the four tables: Contacts, Opportunities, Leads and Accounts (COLA). The CRUD KPI gives the utilization of the COLA tables as well as how many users are making the operations. For Opportunity, we have a fifth KPI called “Opportunities converted” which shows us the number of won deals and the count of salespeople that who converted the opportunity to a won deal.
Charts on the reports are defined by Microsoft, – https://learn.microsoft.com/en-us/dynamics365/sales/view-understand-sales-usage-reports I have listed the information from the Microsoft docs site below for ease of reading.
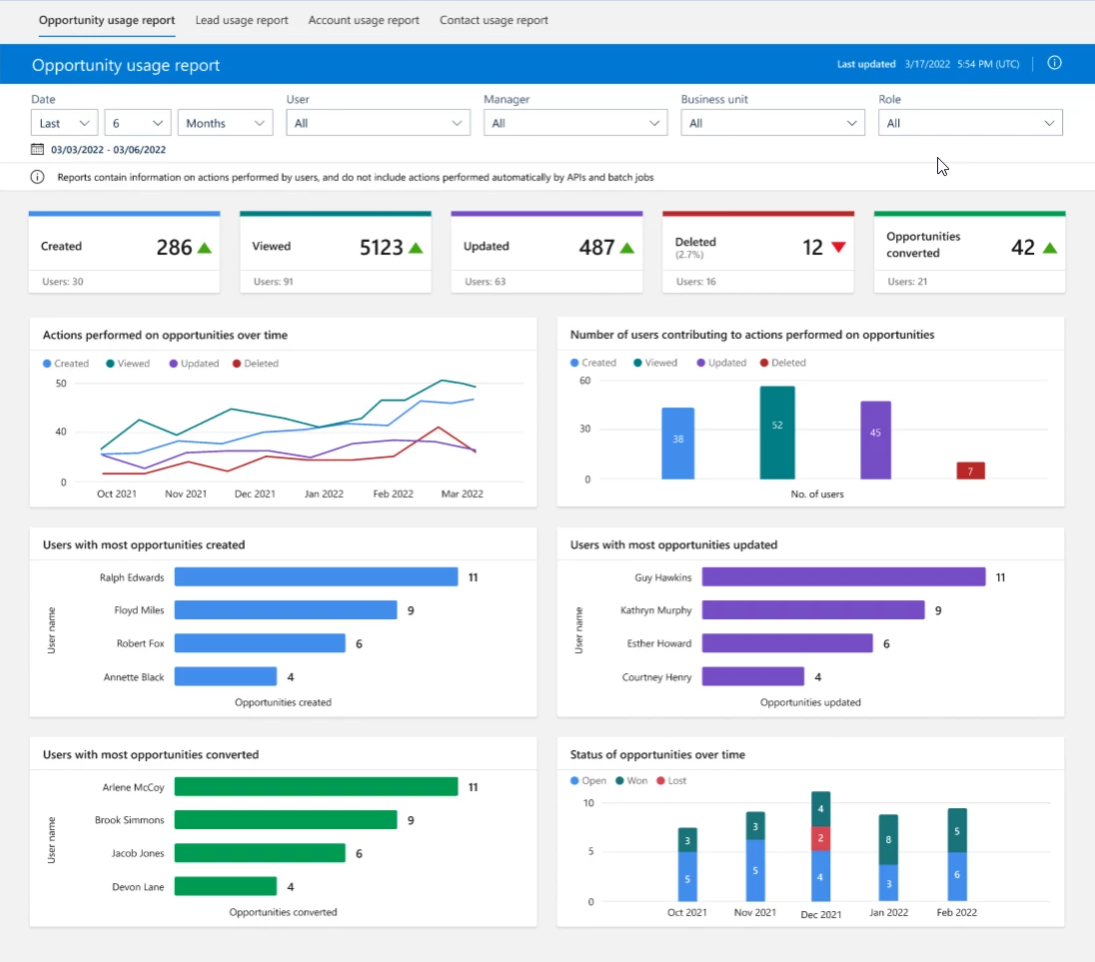
- Opportunity usage report
| Chart name | Description |
| Actions performed on opportunities over time | The trend of actions taken on opportunities in the specified time period: created, viewed, updated, and deleted |
| Number of users contributing to actions performed on opportunities | The number of users who performed various actions on opportunities during the specified time period |
| Users with most opportunities created | The top four contributors who created opportunities during the specified time period |
| Users with most opportunities updated | The top four contributors who updated opportunities during the specified time period |
| Users with most opportunities converted | The top four contributors who converted opportunities into won deals during the specified time period |
| Status of opportunities over time | A breakdown of opportunities by status during the specified time period |
- Lead usage report
| Chart name | Description |
| Actions performed on leads over time | The trend of actions taken on leads in the specified time period: created, viewed, updated, and deleted |
| Number of users contributing to actions performed on leads | The number of users who performed various actions on leads during the specified time period |
| Users with most leads created | The top four contributors who created leads during the specified time period |
| Users with most leads updated | The top four contributors who updated leads during the specified time period |
| Users with most leads qualified | The top four contributors who successfully qualified leads into opportunities during the specified time period |
| Status of leads over time | A breakdown of leads by status during the specified time period |
- Account usage report
| Chart name | Description |
| Actions performed on accounts over time | The trend of actions taken on accounts in the specified time period: created, viewed, updated, and deleted |
| Number of users contributing to actions performed on accounts | The number of users who performed various actions on accounts during the specified time period |
| Users with most accounts created | The top four contributors who created accounts during the specified time period |
| Users with most accounts updated | The top four contributors who updated accounts during the specified time period |
- Contact usage report
| Chart name | Description |
| Actions performed on contacts over time | The trend of actions taken on contacts in the specified time period: created, viewed, updated, and deleted |
| Number of users contributing to actions performed on contacts | The number of users who performed various actions on contacts during the specified time period |
| Users with most contacts created | The top four contributors who created contacts during the specified time period |
| Users with most contacts updated | The top four contributors who updated contacts during the specified time period |